Climate Change Statistics in 2025: What the Latest Data Reveals About Our Planet
The world is experiencing climate change not as a distant possibility, but as a present reality. Today, climate change statistics are everywhere—in news headlines, government reports, and scientific journals. These numbers are not just data; they are a wake-up call that tells us what is truly happening to our planet. At Digital Madama, we focus on making these complex facts clear and accessible. Whether you are worried about environmental disasters, curious about climate challenges, or want to understand how arms conflicts harm the environment, our mission is to inform and inspire action.
In 2025, the numbers paint a dramatic picture. The global temperature is rising faster than predicted, carbon emissions are still near record highs, and sea levels continue to climb. Extreme weather events are more frequent and intense. Each of these trends has a direct impact on people, wildlife, and economies worldwide. This article will break down the latest statistics, explain what they mean, share real-world examples, and suggest practical steps for individuals and governments. The goal is to help you see the story behind the numbers—and what you can do to shape a better future.
The Rising Global Temperature: A Measurable Reality
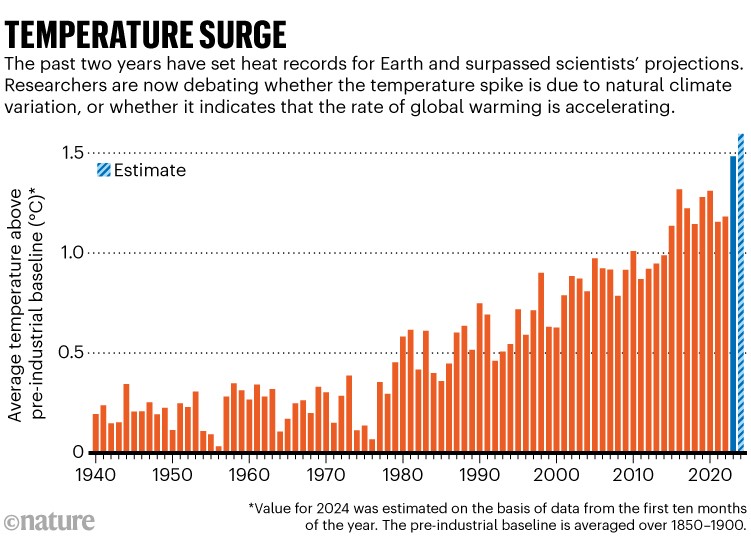
One of the most important climate change statistics is the average global temperature rise. According to the World Meteorological Organization, 2023 and 2024 were the two hottest years on record. By 2025, data shows that the Earth’s average surface temperature is now 1.3°C higher than in the late 19th century.
Why does this number matter so much? A rise of 1.3°C may sound small, but it means massive changes to weather patterns, ecosystems, and even human health. Scientists warn that if the world passes 1.5°C, the risk of dangerous and irreversible damage increases sharply. This includes longer heatwaves, stronger storms, and the loss of coral reefs.
The Earth’s temperature has always changed slowly over thousands of years, but what is different now is the speed. The warming since 1900 has happened in just over a century—a blink of an eye in Earth’s history. This fast change gives less time for people, animals, and plants to adapt.
What Does 1.3°c Warmer Mean?
- Longer heatwaves: Cities in Europe, Asia, and North America are experiencing more days above 40°C. In 2024, India faced a record-breaking heatwave that lasted nearly two months, affecting millions of people. These heatwaves are not just uncomfortable; they cause deaths, damage crops, and put pressure on electricity grids as everyone tries to stay cool.
- Shrinking ice caps: The Arctic sea ice reached its lowest summer level in history in 2023, and 2025 projections show further decline. The Arctic is warming almost four times faster than the global average. Melting ice does not just raise sea levels; it also removes the bright surface that reflects sunlight, so even more heat is absorbed.
- Changing seasons: Spring is arriving earlier, and winters are shorter in many regions, disrupting farming and local wildlife. For example, cherry blossoms in Japan now bloom up to two weeks earlier than 50 years ago. This affects farmers who rely on regular seasons for planting and harvesting, and can confuse animals that depend on seasonal cues for migration and breeding.
Heatwaves are more dangerous than most people realize. Hospitals can become crowded with patients suffering from heatstroke or dehydration. In some cities, outdoor workers have to stop working for hours or even days, reducing productivity and income. Children, the elderly, and people with health problems are especially at risk.
Non-obvious insight: A small change in average temperature can mean much larger changes in local weather extremes. For example, a 1°C rise globally can make heatwaves five times more likely in some areas.
Another fact many miss is that hotter nights are becoming more common, not just hotter days. When nights stay warm, people cannot cool down, which increases health risks. Crops and animals also need cooler nights to recover from daytime heat.
Real-world Example
In 2024, southern Europe suffered its worst wildfire season ever. The main cause? High temperatures and drought fueled by climate change. Over 500,000 hectares of forest burned, destroying homes and forcing thousands to flee.
The fires in Greece, Spain, and Italy were so intense that cities far away were covered in smoke. Tourism, a big part of the economy in these countries, dropped as visitors stayed away. Recovery is slow—many families lost both their homes and jobs.
Wildfires also release more CO₂, creating a feedback loop that makes warming worse.
Another example is in Canada, where the 2024 fire season destroyed entire towns in British Columbia and Alberta. The smoke traveled thousands of kilometers, causing poor air quality as far as New York City. Schools had to close, and flights were delayed or canceled due to low visibility.
Global Carbon Emissions: The Main Driver
Carbon emissions are the main reason temperatures keep rising. The burning of coal, oil, and gas releases carbon dioxide (CO₂) and other greenhouse gases into the atmosphere. According to the Global Carbon Project, total CO₂ emissions in 2024 reached 36.8 billion metric tons—just slightly below the 2022 record.
These emissions come from many sources:
- Power generation: Coal, oil, and gas power plants are still the main way the world produces electricity. Even as wind and solar grow, fossil fuels are not disappearing fast enough.
- Transportation: Cars, trucks, ships, and planes burn huge amounts of fuel. Air travel is growing, with more people flying each year.
- Industry: Factories that make steel, cement, and chemicals use a lot of energy and release greenhouse gases.
- Agriculture: Fertilizer use and livestock (especially cows) create methane, a powerful greenhouse gas.
2025 Carbon Emissions At A Glance
| Country/Region | CO₂ Emissions (Billion Tons, 2025) | Change from 2020 | Per Capita Emissions (Tons/Person) |
|---|---|---|---|
| China | 11.5 | +5% | 8.1 |
| United States | 5.0 | -2% | 15.2 |
| European Union | 3.0 | -8% | 6.7 |
| India | 2.9 | +6% | 2.1 |
| Global Total | 36.8 | +1% | 4.6 |
This table shows that some countries are reducing emissions, but the global total is still rising. The main sources are power plants, transportation, and industry.
Per capita emissions are important because they show how much each person contributes. For example, the average American produces almost twice as much CO₂ as a European, and seven times more than an Indian. But China, with its large population, is now the biggest single emitter overall.
Non-obvious insight: Even as some developed countries cut emissions, increases in developing nations can cancel out global progress. The world must find fair and practical solutions for all.
Some countries are trapped by their energy needs and economic growth. For instance, India and other fast-growing economies still rely on coal because it is cheap and supports jobs. This makes international cooperation and support, like climate finance, critical.
What Does This Mean For The Future?
If emissions do not fall sharply by 2030, it will be almost impossible to keep warming below 2°C. This will lead to more extreme weather, food shortages, and health risks. For example, the United Nations warns that by 2050, over 140 million people may be forced to move because of climate impacts.
Some sectors are harder to decarbonize than others. Heavy industry and long-distance transport (like shipping and aviation) have fewer alternatives to fossil fuels. This is why innovation and investment in new technology—such as hydrogen power, electric planes, and carbon capture—are so important.
Non-obvious insight: Delaying emission cuts now means much faster, more painful changes will be needed later. It’s like waiting too long to fix a leak—small problems become big disasters.

Sea-level Rise: The Slow-moving Threat
Another key climate change statistic is sea-level rise. Warmer temperatures are melting glaciers and ice sheets, adding more water to the oceans. According to NASA, the average global sea level in 2025 is about 22 centimeters higher than in 1900—and the rate is speeding up.
Rising seas are not the same everywhere. Some places, like the Western Pacific and Indian Ocean, are rising faster due to ocean currents and land sinking (subsidence). Other places, such as parts of Scandinavia, have slower rise because the land is moving up after the last ice age.
Data On Rising Seas
| Year | Global Mean Sea Level (cm above 1900) | Annual Rise (mm) |
|---|---|---|
| 2000 | 15 | 2.8 |
| 2010 | 17 | 3.1 |
| 2020 | 20 | 3.5 |
| 2025 | 22 | 4.1 |
| 2030 (Projected) | 24.5 | 4.6 |
The rise may seem slow, but for coastal cities, every centimeter matters. Higher seas mean more flooding, erosion, and saltwater damage to crops and drinking water.
In the past, it took thousands of years for sea levels to rise by 20 centimeters. Now, it has happened in just over 100 years. This means coastal defenses built decades ago are no longer enough. Many cities face the choice of spending billions on new barriers or moving people and infrastructure away from the coast.
Real-world Example
In 2025, Jakarta, Indonesia, is one of the fastest-sinking cities on earth. Parts of the city flood every year, forcing the government to start moving the capital. Miami, New York, and Lagos also face regular flooding from storms and high tides.
Jakarta’s problems are made worse by groundwater pumping. As people pump water from underground, the land sinks, making flooding even worse. The government plans to move the capital to Borneo, but this will take decades and cost billions.
In the United States, Miami is spending hundreds of millions of dollars to raise streets, install pumps, and protect homes. But even these measures may not be enough if sea levels keep rising. Insurance companies are raising premiums or refusing to cover homes in risky areas.
Non-obvious insight: Many people think sea-level rise is just about water. But the real danger is how it combines with storms, making disasters much worse and more costly.
Saltwater intrusion is another hidden problem. As the sea moves inland, it contaminates drinking water wells and farmland, making it harder to grow food or have safe water. This is already affecting communities in Bangladesh, Vietnam, and parts of Florida.
Extreme Weather: The New Normal
The rise in extreme weather events is one of the most visible signs of climate change. From heatwaves and hurricanes to floods and wildfires, these disasters are happening more often—and hitting harder.
Extreme weather does not just cause temporary problems. It damages roads, bridges, power lines, and homes. The costs add up: global disaster losses in 2024 reached over $350 billion, according to reinsurance data. Some countries spend more on recovery than on education or healthcare.
Key 2025 Statistics
- Heatwaves: 2024 and 2025 saw record-breaking heat in Europe, Asia, and North America. Over 700 million people experienced at least one dangerous heatwave in 2025. In Japan and South Korea, outdoor festivals and sporting events were canceled for safety.
- Hurricanes and cyclones: The Atlantic had 21 named storms in 2024, the most since 2020. Super Typhoon Mawar hit the Philippines with winds over 300 km/h in early 2025. The cost to rebuild in the Philippines exceeded $15 billion.
- Floods: Pakistan, Bangladesh, and parts of the U.S. Midwest suffered major floods, causing billions in damage and displacing millions. In Pakistan, repeated floods make it harder for families to rebuild between disasters, increasing poverty.
- Wildfires: Australia and Canada lost over 10 million hectares of forest to fires in 2024-2025. In some areas, the smoke lasted for weeks, closing airports and causing health problems for thousands.
What Is Causing This Surge?
Warmer oceans and air hold more energy and moisture, which fuels stronger storms and more intense rain. Droughts last longer because higher temperatures dry out the land. These changes are not random—they are linked to the rising greenhouse gases in our atmosphere.
Storms are not just more powerful; they are also moving more slowly. This means more rain falls in one place, raising the risk of floods. In 2024, Hurricane Harvey (USA) and Cyclone Yaas (India) both stalled over land, causing historic flooding.
Non-obvious insight: Extreme events often happen together, making recovery harder. For example, heatwaves can lead to wildfires, and then heavy rain can cause floods in burned areas.
Another overlooked effect is “compound disasters,” where one event makes another worse. After a wildfire, the land cannot absorb rain, so even small storms can cause landslides or mudflows. This happened in California in 2024, when fires were followed by deadly mudslides.
The Human Impact: Who Suffers Most?
Climate change affects everyone, but not equally. Some groups and countries are much more vulnerable than others. Low-income communities, small island nations, and people living in fragile areas face the highest risks.
People who depend on nature for their jobs—like farmers, fishers, and herders—are hit hardest. They have fewer resources to adapt and little insurance or savings to fall back on.
Examples Of Impact
- Small islands: Countries like the Maldives and Tuvalu are losing land to the sea. In 2025, several villages in Tuvalu had to be abandoned. People must leave behind homes, schools, and graves of loved ones. The loss of land creates “climate refugees” who have nowhere to go.
- Farmers: Changing rainfall makes it harder to grow crops. In East Africa, millions faced food shortages after years of drought followed by floods. Yields of maize and wheat fell by up to 30% in some areas, leading to higher food prices and hunger.
- Urban poor: In cities, heatwaves and floods hit slums hardest, where people have less shelter and fewer resources. Many slum neighborhoods are built in flood-prone or low-lying areas. When disasters strike, rebuilding is slow, and aid can be hard to reach.
Non-obvious insight: Climate change can increase social tensions and even conflict. When water or food is scarce, communities may fight over resources, leading to instability.
For example, in the Sahel region of Africa, farmers and herders sometimes clash over shrinking water sources and pastureland. In Syria, a severe drought from 2006–2010 contributed to rural poverty, migration to cities, and social unrest before the civil war.
Another overlooked impact is on mental health. People who lose homes, jobs, or loved ones to disasters often suffer from anxiety, depression, or trauma. Children who live through repeated disasters may struggle in school or have trouble sleeping.
Environmental Damage: More Than Just Weather
The planet’s natural systems are under pressure. Climate change is not just about heat and storms; it also affects forests, oceans, and wildlife in complex ways.
Forests
Forests absorb carbon, but rising temperatures and droughts weaken them. Fires destroy millions of trees, releasing even more CO₂. In the Amazon, deforestation and drought threaten to turn the rainforest into grassland—a tipping point that could release huge amounts of carbon.
Forests also provide homes for countless species. When trees die, animals lose food and shelter. In Canada and Siberia, insects like pine beetles are thriving in warmer winters, killing vast stretches of forest.
Oceans
Oceans absorb about a quarter of our CO₂ emissions, but this makes them more acidic. Acidic water damages coral reefs and shellfish. In 2025, over 60% of the world’s coral reefs are threatened by bleaching.
Bleaching does not just make reefs less beautiful; it kills the coral, which is the foundation for fish and other sea life. This threatens food supplies and tourism in many countries. Warmer water also drives fish away from traditional fishing grounds, hurting coastal communities.
Another growing concern is the spread of “dead zones”—areas with so little oxygen that almost nothing can live there. These zones are caused by both climate change and pollution.
Wildlife
Many animals must move to survive. Polar bears, penguins, and mountain species lose their habitats. In Africa, elephants and lions struggle as water sources dry up.
Some species are moving north or uphill to escape the heat, but not all can move fast enough. In the Alps, some plants and insects have run out of mountain to climb. In the Arctic, walruses crowd onto shrinking ice floes, making them easy targets for predators.
Non-obvious insight: Changes in one part of nature can trigger a chain reaction. Losing bees, for example, hurts crop pollination and food supplies.
Another example: as ice melts in the Arctic, shipping lanes open up, bringing more pollution and risk of oil spills to fragile ecosystems.

Comparing Climate Change Across Regions
Not all regions experience climate change in the same way. To see this, compare the impact on continents in 2025:
| Continent | Average Temp Change (°C) | Main Climate Challenge | Major 2025 Event |
|---|---|---|---|
| Asia | +1.6 | Heatwaves, Floods | India heatwave, China flooding |
| Europe | +2.0 | Wildfires, Heatwaves | Southern Europe wildfires |
| Africa | +1.2 | Drought, Food Crisis | East Africa drought, locusts |
| North America | +1.5 | Storms, Drought | California wildfires, Midwest floods |
| Oceania | +1.1 | Sea-level Rise, Coral Bleaching | Great Barrier Reef bleaching |
| South America | +1.3 | Rainforest Loss, Drought | Amazon fires, Andean glacier melt |
This comparison shows that the problems are global but the details are local. Solutions must fit each region’s needs.
For example, in Europe, the heat has made some traditional crops (like wheat) harder to grow, while vineyards in England now produce more wine as the climate warms. In South America, Andean glaciers are melting, reducing water for cities and farms during dry seasons.
Non-obvious insight: Many solutions must be tailored to local cultures and economies. What works in Germany may not work in Kenya or Brazil. Listening to local voices is key.
Why Are These Numbers Rising?
Understanding why climate change statistics keep rising is the first step to solving the crisis. The main causes are:
- Fossil fuels: Most energy still comes from coal, oil, and gas.
- Deforestation: Cutting down forests removes nature’s carbon sinks.
- Growing population: More people means more energy use, food, and land.
- Unsustainable industry and farming: Factories and farms release greenhouse gases and damage nature.
Urbanization also plays a role. As more people move to cities, demand for housing, transport, and goods rises, often increasing emissions. Urban “heat islands” (where city temperatures are higher than nearby countryside) make heatwaves even worse.
Non-obvious insight: Solutions must tackle all these causes together. Focusing on just one—like energy—will not be enough.
We must also change how we live, not just what fuel we use. This means rethinking diets, travel, waste, and even the design of cities and products.
What These Statistics Mean For The Future
The data from 2025 is a warning. If trends continue, the world could see:
- 2°C warming by 2040: More deadly heatwaves, water shortages, and food crises.
- Rising seas flooding major cities: Millions forced to move.
- More disasters: Storms, fires, and droughts become routine.
- Economic costs: Damage to infrastructure, health, and food supply could reach trillions of dollars.
But the future is not fixed. Science shows that fast action can still prevent the worst impacts. The next decade is critical.
Delaying action means more “lock-in”—building new coal plants, highways, or airports creates emissions for decades. Early investment in clean energy and adaptation saves money and lives in the long run.
Non-obvious insight: Many climate solutions also solve other problems, like air pollution, poverty, and poor health. This makes action a “win-win” for society.
How Individuals Can Make A Difference
It may feel that climate change is too big for one person to solve. But individual actions, when multiplied by millions, do matter.
Practical Steps
- Reduce energy use: Switch to LED bulbs, use less air conditioning, and unplug devices. Simple actions like air-drying clothes or washing laundry with cold water save energy.
- Choose cleaner transport: Walk, cycle, use public transport, or consider electric cars. Carpooling and combining errands can cut car use.
- Eat less meat: Livestock farming is a big source of emissions. Even small changes help. Try “meatless Mondays” or switch to more plant-based meals.
- Cut waste: Recycle, avoid single-use plastics, and buy less “fast fashion.” Repair things instead of throwing them away.
- Support green energy: Choose renewable energy providers if possible. Installing solar panels at home is a big step, but even switching your electricity plan to a green provider helps.
- Vote and speak up: Support leaders and policies that put climate action first. Join community groups, sign petitions, or talk to friends and family about climate issues.
Non-obvious insight: Your money matters. Where you bank and what you buy can help or harm the environment.
Many banks and pension funds invest in fossil fuels or polluting industries. Choosing a “green” bank or investment fund can send a powerful signal. Supporting local, sustainable businesses also reduces emissions from shipping and packaging.
Another often-missed step is using your voice online. Social media campaigns, sharing good information, and challenging climate myths can influence others—even policy makers.
What Governments And Businesses Must Do
Individual efforts are important, but real change needs big decisions by governments and companies.
Key Actions
- Cut fossil fuel use: Shift to wind, solar, and other renewables. Set clear deadlines for phasing out coal and gas.
- Protect and restore forests: This absorbs carbon and protects biodiversity. Create incentives for landowners and farmers to plant trees, not cut them.
- Invest in clean technology: Support electric transport, energy efficiency, and green innovation. Offer tax breaks or subsidies for clean energy projects.
- Adapt cities and farms: Build flood defenses and drought-resistant crops. Update building codes to handle extreme weather.
- International cooperation: Climate change is global; solutions must be, too. Rich countries must help poorer ones adapt and switch to clean energy.
Non-obvious insight: Governments can create “green jobs” and new industries by investing in climate solutions, helping both the planet and the economy.
For example, retrofitting buildings for energy efficiency creates jobs for construction workers, electricians, and engineers. Building wind turbines and solar farms creates new manufacturing and maintenance jobs.
Businesses also play a role. Companies can set “net zero” targets, cut waste, and choose greener suppliers. Some firms now require their partners to report emissions and use clean energy.
Real-world Progress And Success Stories
Despite challenges, some countries and cities are making real progress.
- Denmark: Aims to cut emissions by 70% from 1990 levels by 2030, mainly through wind energy. Over half its electricity already comes from wind.
- Costa Rica: Runs on 99% renewable electricity and has doubled forest cover in 30 years. The government pays landowners to protect forests, not cut them.
- China: Leads the world in solar panel production and electric vehicles, though it still uses coal. In 2025, China installed more solar capacity than the rest of the world combined.
Cities like Amsterdam and Bogotá are expanding bike lanes and public transport to cut car use. Amsterdam’s goal is to make the city car-free in the central area by 2030. In Bogotá, car-free days and new bus systems have reduced traffic and pollution.
In Africa, new solar farms bring clean power to millions for the first time. Kenya’s Lake Turkana Wind Power project is the largest in Africa, providing energy for over a million homes.
Non-obvious insight: Many solutions also improve health, create jobs, and reduce poverty.
For example, better insulation in homes not only cuts energy use but also keeps people warmer in winter and cooler in summer, improving health and comfort.
The Role Of Technology And Innovation
Technology is key to solving climate change. In 2025, advances in solar panels, batteries, and electric vehicles are making clean energy cheaper and more reliable.
Examples Of Innovation
- Solar and wind: Costs are now lower than coal or gas in many regions. Even countries without fossil fuels can now make their own electricity.
- Batteries: Better storage means renewable energy can work day and night. Grid-scale batteries are being built in Australia, California, and China.
- Smart grids: Digital systems balance energy supply and demand. This reduces blackouts and makes it easier to add new renewable sources.
- Carbon capture: New machines can remove CO₂ from the air, but they are still expensive. Projects in Iceland and Canada are testing ways to store CO₂ underground.
Non-obvious insight: Technology is not enough alone—governments must make rules to speed up adoption and stop polluters.
For example, electric cars only cut emissions if the electricity comes from clean sources. Rules to phase out gas cars and support charging stations are needed.
Another overlooked area is “nature-based solutions”—using forests, wetlands, and soil to absorb carbon and protect communities from floods or storms.
The Cost Of Inaction
If the world fails to act, the cost will be much higher than the price of solutions.
- Disaster recovery: Hurricanes, floods, and fires cost hundreds of billions each year. Insurance companies are already warning of unaffordable premiums in risky areas.
- Health: Air pollution kills millions and makes people sick. Heatwaves increase deaths, and mosquito-borne diseases like dengue and malaria are spreading to new areas.
- Lost jobs: Farming, fishing, and tourism suffer as the climate changes. In some Pacific islands, coastal erosion threatens not just homes but the entire economy.
The International Monetary Fund says that every dollar spent on climate action saves up to seven dollars later.
Non-obvious insight: Inaction means more migration, social unrest, and even war. Adapting early makes communities stronger and safer.
The Link Between Climate Change And Conflict
At Digital Madama, we also focus on how arms conflicts harm the environment. Wars destroy forests, pollute water, and release greenhouse gases. For example, the war in Syria led to massive fires and oil spills. In Africa, fighting over land and water is made worse by climate stress.
In Ukraine, attacks on fuel depots and chemical plants released toxins into soil and rivers, harming wildlife and people. After wars, landmines and unexploded bombs can make farmland unusable for decades.
Non-obvious insight: Peace and climate action go together. Stable, well-managed countries can adapt better and protect nature.
International agreements, like the Paris Agreement, only work if countries are safe and able to plan for the long term. Helping fragile states build peace and resilience is part of fighting climate change.
For more in-depth research on climate change, visit the NASA Climate Change website.
Frequently Asked Questions
What Is The Main Cause Of Climate Change In 2025?
The main cause is the burning of fossil fuels like coal, oil, and gas. These release carbon dioxide and other greenhouse gases, which trap heat in the atmosphere and warm the planet.
Other causes include deforestation and some types of farming, but fossil fuels are the biggest factor.
How Fast Are Sea Levels Rising Right Now?
In 2025, global sea levels are rising at about 4.1 millimeters per year, the fastest rate ever measured. This is due to melting ice sheets and glaciers, as well as the expansion of warmer ocean water.
Some cities experience even higher rates due to land sinking or local factors.
Are Extreme Weather Events Really Getting Worse?
Yes. Data from 2025 shows more frequent and severe heatwaves, hurricanes, floods, and wildfires in many regions. These events are linked to higher global temperatures and changing weather patterns.
Extreme events are also more costly and harder to predict, making them a bigger risk for governments and insurers.
Can Individual Actions Really Help Fight Climate Change?
Individual actions do make a difference, especially when millions of people act together. Reducing energy use, cutting waste, and choosing sustainable products all help lower emissions. However, government and business action is also critical.
Your choices also influence others—family, friends, and even companies notice and respond to customer demand.
What Are The Most Effective Solutions For Climate Change?
The most effective solutions are reducing fossil fuel use, protecting forests, switching to renewable energy, and adapting cities and farms to new climate conditions. International cooperation and investment in new technology are also essential.
Action must be fast, fair, and global to succeed.
The climate change statistics of 2025 show a planet at a turning point. The numbers are clear: urgent action is needed. At Digital Madama, we believe that understanding the data is the first step to making smarter choices, both as individuals and as a society. The future depends on what we do next—let’s choose action, not inaction.