Climate change has moved from theory to fact. Every year, numbers show that our world is changing—fast. Temperatures keep rising, sea levels are creeping up, and extreme weather events are more common. These facts are not just for scientists. They affect everyone, from city dwellers to farmers, in every country. In this article, we’ll break down the most important statistics, explain what they mean for humanity, and show how both people and governments can act now. Whether you’re new to the topic or want deeper insight, Digital Madama brings you a clear, data-driven look at climate change and its deadly impact.
Global Temperature Rise: The World Is Heating Up
One of the strongest signs of climate change is the steady increase in global average temperatures. According to NASA, Earth’s average surface temperature has risen by about 1.2°C (2.2°F) since the late 19th century. This may sound small, but in climate terms, it’s massive.
What Does A Few Degrees Mean?
A global temperature rise of just 1.2°C already brings big changes. Heatwaves are longer and more intense. Ice in the Arctic is melting faster. Crops suffer from drought. A rise of 2°C or more is considered a dangerous threshold by scientists. At that point, natural disasters and food shortages could become much worse.
To put things in perspective, think about your own body temperature. A rise of 1°C in your body can signal a fever and make you feel sick. The Earth’s systems are even more sensitive. A 2°C jump in global temperature would push many natural and human systems beyond what they can handle.
Extreme heatwaves have already become more frequent. In the past, a “once-in-50-years” heatwave now happens every 10 years. At 2°C, these could happen every few years. More heat means more evaporation, which can dry out soils and harm plants and animals. It also stresses power grids as more people use air conditioning, sometimes causing blackouts.
Ice melt is another key concern. In Greenland, ice is melting seven times faster than it did in the 1990s. This not only raises sea levels, but also changes ocean currents, which can affect weather patterns far away. Melting ice in the Arctic also releases methane, a powerful greenhouse gas, creating a feedback loop that speeds up warming.
Recent Data
The last eight years were the hottest on record. In 2023, the global average temperature was about 1.48°C above pre-industrial levels. Some countries, like India, saw deadly heatwaves that killed hundreds. In Europe, heatwaves in 2022 led to over 61,000 excess deaths, according to a study published in Nature Medicine.
Global warming is not slowing down. Every decade since the 1970s has been warmer than the last. The 2010s were warmer than the 2000s, and the trend continues. This is not just a record on paper—people feel it every day.
Farmers struggle with shorter growing seasons. Ski resorts close early as snow disappears. Hospitals prepare for more patients as heatwaves hit cities.
Scientists track these changes using satellites, weather stations, and ocean buoys. They see that the warming is not the same everywhere. The Arctic is warming four times faster than the global average. Some regions, such as the Middle East and South Asia, are seeing record heat, sometimes above 50°C (122°F), which can be deadly even for healthy adults.
Why Does This Matter?
Small temperature changes change everything:
- Rivers dry up and threaten water supply.
- More people die from heat-related illnesses.
- Certain crops cannot grow, leading to food shortages.
Digital Madama looks at these numbers and sees a clear warning: if warming continues, millions could be at risk from hunger, disease, or disaster.
It’s important to remember that even small changes in temperature can tip the balance in fragile systems. For example, coral reefs start to bleach and die when water temperatures rise by just 1-2°C. These reefs support millions of marine species and protect coastlines from storms.
Another non-obvious insight: higher temperatures can also lead to more pests and diseases. For example, mosquitoes that carry malaria and dengue can now survive in places that used to be too cold. This puts new populations at risk of disease.
If we do not act soon, the world may face “compound events”—for example, a heatwave and a drought happening at the same time, which can wipe out crops and strain water supplies. These events are harder to manage and recover from, especially for poorer countries.
Carbon Emissions: The Main Driver
Carbon dioxide (CO₂) is the biggest cause of climate change. It comes mainly from burning fossil fuels like coal, oil, and gas. The more CO₂ in the air, the more heat gets trapped near Earth’s surface.
Key Statistics
- In 2022, global CO₂ emissions reached around 36.8 billion metric tons—a new record.
- The world’s CO₂ concentration in the atmosphere hit 419 parts per million (ppm), the highest in at least 800,000 years.
To visualize this, imagine that every year, humans add a layer of “invisible insulation” around the planet. This insulation traps more heat, making it harder for the planet to cool down. Even if we stopped all emissions today, much of the CO₂ would stay in the air for centuries, keeping the planet warmer.
Since the Industrial Revolution, we have pumped more than 2.4 trillion tons of CO₂ into the atmosphere. Natural systems like forests and oceans absorb some of it, but not enough to balance what we add every year. In fact, forests and oceans are under stress from the warming they help slow down.
Who Produces The Most?
Some countries release more carbon than others. Here’s a look at the top emitters:
| Country | CO₂ Emissions (Billion Tons, 2022) | World Share (%) |
|---|---|---|
| China | 11.4 | 31% |
| United States | 5.0 | 14% |
| India | 2.6 | 7% |
| European Union | 2.3 | 6% |
| Others | 15.5 | 42% |
These numbers show that just a few countries are responsible for most emissions. However, emissions per person can be very different. For example, the average American or Australian uses much more energy than someone in India or Africa.
It’s also important to note that some countries export a lot of goods to others. For example, many of China’s emissions come from factories that make products for Europe or the U. S. This is called “carbon leakage,” and it makes it harder to assign responsibility.
Why Is This Important?
CO₂ stays in the atmosphere for hundreds of years. Today’s emissions will keep warming the planet far into the future. If we don’t cut emissions, scientists warn that we could see a 2.5–4.5°C rise by 2100. This would make life harder for billions.
The science is clear: to keep warming below 2°C, emissions must fall to net zero by around 2050. This means balancing what we put into the air with what we take out, through things like planting trees or using new technology to capture CO₂.
What many people miss is that there are other greenhouse gases, like methane and nitrous oxide, which are even more powerful at trapping heat, but are released in smaller amounts. Methane, for example, comes from cows, rice fields, and leaks in natural gas systems.
Cutting these “short-lived” gases can have a big impact in the short term.
The Human Impact
Carbon emissions are not just numbers. They lead to:
- Higher rates of asthma and lung disease.
- More heat deaths, especially in cities.
- Food and water shortages.
- Economic losses from disasters.
City air pollution from burning fossil fuels is a silent killer. The World Health Organization says air pollution causes about 7 million premature deaths each year. Reducing emissions helps both the climate and our health.
One overlooked fact: Urban “heat islands” (where cities are much hotter than the countryside) are made worse by both rising temperatures and emissions from cars and factories. These heat islands can make cities dangerous during heatwaves, especially for the elderly or those with chronic illnesses.
It’s clear: the fight against climate change is the fight to reduce carbon emissions.
Sea Level Rise: A Slow-moving Threat
Another big impact of climate change is rising sea levels. As ice in Greenland and Antarctica melts, and as oceans warm and expand, seas rise higher.
Key Numbers
- Since 1880, global sea levels have risen by about 23 centimeters (9 inches).
- The current rate is about 3.4 millimeters per year—more than double the average rate of last century.
This may not sound like much, but it adds up over time. For many low-lying cities and islands, a few extra centimeters make the difference between safety and disaster. Sea level rise is not the same everywhere—some places see much higher local increases due to currents, sinking land, or melting glaciers nearby.
Thermal expansion is one major cause. As water gets warmer, it expands. This alone accounts for about half of the observed sea level rise. The rest comes from melting glaciers and ice sheets.
What Does This Mean For People?
Rising seas threaten millions living in coastal cities. Major cities like Dhaka, Miami, and Jakarta face flooding and salty water ruining drinking supplies. Small island nations, like the Maldives, could disappear.
Some areas are already seeing “sunny day flooding,” where high tides push seawater into streets, even when there is no storm. This damages roads, homes, and businesses, and can shut down entire neighborhoods.
Saltwater intrusion is another problem. As sea levels rise, salt water seeps into underground freshwater supplies, making it hard to find clean drinking water. This affects farming too, as crops can’t grow in salty soil.
Data Table: Cities Most At Risk
| City | Population at Risk (Millions) | Estimated Sea Level Rise by 2100 (cm) |
|---|---|---|
| Jakarta | 10.6 | 70–100 |
| Miami | 2.7 | 60–90 |
| Bangkok | 10.5 | 50–80 |
| Alexandria | 5.2 | 50–75 |
Jakarta is already sinking due to groundwater pumping and is moving its capital to Borneo. Miami faces frequent flooding and is spending billions on pumps and sea walls. In Alexandria, Egypt, rising seas threaten ancient monuments and the homes of millions.
Environmental And Human Cost
Rising seas cause:
- Loss of homes and farmland.
- More dangerous storms and floods.
- Mass migration as people leave flooded areas.
One non-obvious fact: Even small rises in sea level make storm surges more deadly. A 10-cm rise can mean thousands more at risk during a hurricane.
Coastal wetlands, which protect against storms and provide homes for birds and fish, are disappearing. As these areas vanish, both people and wildlife lose important protection.
In many places, sea level rise leads to “climate gentrification. ” Wealthier people move away from flood-prone areas, while poorer residents are left in the most dangerous places, deepening inequality.
Extreme Weather Events: The Numbers Are Shocking
Extreme weather is now more common and more severe. Think heatwaves, hurricanes, wildfires, and floods.
Key Data Points
- Between 2000 and 2019, there were 7,348 major disaster events, compared to 4,212 between 1980 and 1999.
- In 2022 alone, disasters linked to weather killed over 15,000 people and caused $313 billion in damages, according to the World Meteorological Organization.
The number of extreme weather events has nearly doubled in the past 40 years. These include not just massive hurricanes, but also droughts, wildfires, and cold snaps. Climate change makes these events both more likely and more severe.
Insurance companies are now warning that some areas may become “uninsurable” due to repeated disasters. This means people can’t protect their homes or businesses, making recovery harder.
Real-world Examples
- In 2023, wildfires in Canada and Greece burned millions of acres and forced mass evacuations.
- Floods in Pakistan in 2022 killed over 1,700 people and displaced millions.
- The 2021 European floods killed over 200 and caused billions in damage.
These disasters don’t just happen in faraway places. In the United States, Hurricane Katrina in 2005 killed over 1,800 people and left New Orleans underwater. In Japan, typhoons have caused record floods and landslides, leading to loss of life and massive rebuilding costs.
One point often missed: disasters can cause long-term harm, even after the initial event is over. For example, after a wildfire, rain can cause mudslides because the soil no longer holds together. Floods can leave behind mold and bacteria, leading to health problems months or years later.
How Does This Affect Mortality?
Heatwaves, floods, and storms lead to higher mortality rates. For example:
- In India, heatwaves are now the third biggest cause of death from natural disasters.
- In Europe, deaths from heatwaves are expected to double by 2050.
Deaths are not limited to the event itself. In the weeks after a disaster, deaths from heart attacks, infections, and mental health issues often rise. Hospitals may be overwhelmed or damaged, making care harder to access.
Wildfires cause spikes in air pollution, which can trigger asthma attacks and heart problems, especially in children and older adults.
Climate Change And Mortality Rates: Connecting The Dots
It’s not always easy to see how climate numbers connect to deaths. But the link is real, and growing stronger.
Direct Causes
- Heatwaves: Cause dehydration, heatstroke, and heart problems.
- Floods: Lead to drowning, waterborne diseases, and injuries.
- Storms: Cause trauma, loss of shelter, and food shortages.
- Wildfires: Lead to burns, smoke inhalation, and longer-term lung disease.
Heatwaves are especially deadly in cities, where buildings and roads trap heat. Elderly people, outdoor workers, and those without air conditioning are most at risk. In France’s 2003 heatwave, many victims were older adults living alone, with little support.
Floods can wipe out entire communities. After the water recedes, people face risks from dirty water, mosquitoes, and lack of clean food. Children are especially vulnerable to diseases like cholera and diarrhea.
Storms like hurricanes and typhoons can destroy hospitals and roads, making rescue and recovery difficult. After the storm passes, survivors may face weeks without power, clean water, or medicine.
Wildfires are getting worse as temperatures rise and droughts dry out forests. These fires can spread quickly, leaving little time to escape. Even people far from the fire can suffer from smoke, which travels hundreds of miles and causes breathing problems.
Indirect Causes
- Malnutrition: Failed crops mean less food.
- Disease: Warmer weather spreads diseases like malaria and dengue.
- Mental health: Disasters increase anxiety, depression, and suicide rates.
Food shortages are a growing problem. In East Africa, repeated droughts have led to crop failures and hunger. Children are the first to suffer, as their bodies need more nutrients to grow.
Diseases are spreading to new areas. Dengue fever, once found only in the tropics, is now seen in southern Europe and the southern United States. Tick-borne diseases like Lyme disease are moving north as winters get milder.
Mental health is often overlooked. Survivors of disasters face stress, trauma, and loss. After Hurricane Maria in Puerto Rico, suicide rates rose as people struggled with power outages and loss.
Key Numbers On Mortality
- The World Health Organization (WHO) estimates that between 2030 and 2050, climate change will cause 250,000 extra deaths per year from heat, malnutrition, malaria, and diarrhea.
- In 2021, heatwaves in the U.S. killed more people than hurricanes, floods, and tornadoes combined.
These deaths are not evenly spread. Poorer countries and vulnerable groups are hit hardest. In some regions, climate change could reverse decades of progress in health and poverty reduction.
A key point: these numbers likely underestimate the real impact. Many climate-related deaths are missed in official records, especially when they happen weeks or months after a disaster, or when people die from diseases made worse by climate change.
Vulnerable Groups: Who Suffers Most?
Not everyone faces the same risk from climate change. Some groups are hit harder than others.
Most At Risk
- Children: Their bodies are more sensitive to heat and disease.
- Elderly: More likely to die from heat or cold.
- Poor communities: Have fewer resources to adapt or escape.
- People with health issues: Chronic illnesses are made worse by extreme weather.
Children are especially at risk because their immune systems are not fully developed. Heatwaves can quickly cause dehydration or heatstroke in young children. Poor nutrition from failed crops can stunt their growth and affect brain development.
Elderly people may have trouble moving to safety during disasters. Many live alone, with no one to check on them. Chronic health problems, like heart disease or diabetes, can get worse in extreme heat or after losing access to medication.
Poor communities often live in the most dangerous places—like floodplains or crowded urban neighborhoods. They may lack air conditioning, clean water, or strong housing. When disaster strikes, they have fewer savings or insurance to help them recover.
People with disabilities face extra challenges. During disasters, evacuation plans may not consider wheelchairs or medical equipment. Afterward, services may be slow to return.
Geographic Differences
Some regions are more exposed:
- Africa: Droughts and food shortages are common.
- Asia: Floods and typhoons affect millions.
- Small Islands: Sea level rise threatens their very survival.
Africa is especially vulnerable because many people rely on farming and have little access to irrigation. When rains fail, millions can go hungry. In the Horn of Africa, repeated droughts have forced families to leave their homes.
Asia sees some of the world’s deadliest floods and storms. Bangladesh, for example, is crisscrossed by rivers and often hit by cyclones. Millions live just above sea level, with few resources to rebuild after disaster.
Small islands in the Pacific and Indian Oceans are at risk of disappearing. In some places, saltwater is already ruining crops and drinking water. Residents must decide whether to stay and adapt, or leave their homes forever.
Digital Madama highlights these disparities because fighting climate change also means fighting for justice.
A deeper insight: Climate change can make existing inequalities worse. Groups already facing discrimination—like Indigenous peoples or migrants—may have the hardest time getting help. Solutions must be fair and include everyone.

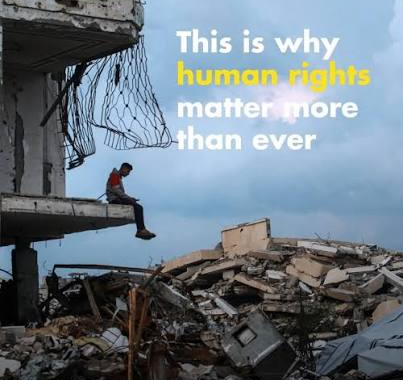
Credit: libertiesjournal.com
The Economic Cost: More Than Just Money
Climate change does not only kill people—it harms economies too. Disasters destroy homes, farms, and businesses.
Data Table: Economic Losses By Event
| Event Type | 2022 Losses (Billion USD) | Region Most Impacted |
|---|---|---|
| Hurricanes & Typhoons | 110 | North America, Asia |
| Floods | 82 | Asia, Europe |
| Wildfires | 21 | North America, Australia |
| Droughts | 17 | Africa, Asia |
These losses are not just numbers on a page. After a hurricane, families may lose their homes, schools may be damaged, and businesses may never reopen. Farmers can lose entire harvests, leaving debts and hunger.
Hidden Costs
- Lost education when schools close after disasters.
- Mental health costs from trauma.
- Increased migration, creating pressure on cities.
Children may miss weeks or months of school after a disaster. Some never return, dropping out to help their families survive. Mental health care is often overlooked, but trauma can last a lifetime, affecting work and relationships.
Migration is a growing issue. As farmland dries up or floods, people move to cities, adding pressure on jobs, housing, and services. This can cause tension and even conflict between newcomers and long-time residents.
A non-obvious insight: Economic losses from climate change can cause a cycle of poverty. Families may sell land or assets to survive, making it harder to recover after the next disaster.
Insurance companies are already raising rates or refusing to cover some high-risk areas. This leaves people unprotected and governments with bigger bills.
Climate Change And Environmental Disasters: A Closer Look
Environmental disasters are becoming more frequent and severe due to climate change. These disasters can destroy entire ecosystems and make human survival more difficult.
Case Study: The 2022 Pakistan Floods
- Over 33 million people affected.
- Crops and livestock destroyed, leading to food shortages.
- Long-term health risks from dirty water and mold.
Heavy monsoon rains, made worse by warming, caused rivers to overflow. Whole villages disappeared under water for weeks. Many survivors lived in tents for months, exposed to mosquitoes and diseases. Children missed school, and families lost their only source of food.
Case Study: Australian Wildfires 2019–2020
- Burned 18.6 million hectares.
- Over 3 billion animals killed or displaced.
- Air pollution reached dangerous levels in major cities.
The fires created their own weather, with lightning and firestorms spreading flames. Koalas, kangaroos, and many bird species died or lost their homes. Smoke drifted as far as New Zealand, turning skies orange and causing health warnings.
These disasters show how climate change can cause “cascading impacts.” A single event can disrupt food, water, health, and the economy all at once. Recovery can take years, if it happens at all.
Lessons Learned
Disasters show how climate change harms both people and nature. Recovery is slow, and some damage cannot be fixed.
One non-obvious fact: When forests burn or wetlands flood, they release huge amounts of stored carbon, making climate change even worse. This creates a feedback loop, where disasters today make tomorrow’s disasters more likely.
Another insight: Environmental damage can lead to new diseases. When animals lose their homes, they may move closer to people, increasing the risk of viruses spreading from wildlife to humans.
How Arms Conflicts Harm The Environment
War and armed conflicts make climate problems worse. Fighting destroys forests, pollutes water, and harms wildlife.
Key Examples
- In Syria, years of war have dried up rivers and ruined farmland.
- In Ukraine, shelling has started wildfires and polluted soils.
- In Africa, armed groups cut down forests for shelter or fuel.
Conflicts can also destroy water treatment plants, dams, and power lines. This leaves survivors without clean water or electricity, making it harder to adapt to climate change.
Landmines and unexploded bombs make it dangerous for farmers to return to their fields after fighting ends. This leads to abandoned land and lost food production.
Why This Matters
- Conflicts make it harder to adapt to climate change.
- Refugees from war often move to areas already stressed by climate.
- Rebuilding after war uses resources that could fight climate change.
When people flee fighting, they often end up in camps or cities already struggling with drought or floods. This puts extra pressure on food, water, and housing.
A non-obvious point: Wars often break out over resources made scarce by climate change—like water or fertile land. Climate change can act as a “threat multiplier,” making conflicts more likely or harder to solve.
Digital Madama explores these connections to help readers see the full picture.
What The Numbers Reveal For The Future
The data is clear: climate change is deadly and getting worse. If we do nothing, more people will die from heat, hunger, disease, and disasters.
Three Key Statistics To Remember
- 1.2°C global temperature rise is already deadly. Passing 2°C will be catastrophic.
- 36.8 billion tons of CO₂ emissions per year is unsustainable.
- Sea levels rising by 3.4 mm per year put hundreds of millions at risk.
These facts should not make us hopeless. They are a call to action. Every tenth of a degree we save can prevent suffering and death for millions.
Non-obvious Insights
- Many deaths from climate change are not counted in official numbers. For example, deaths caused by disease after a flood are often missed.
- Slow disasters (like drought or sea level rise) kill more people over time than sudden events like storms.
Another insight: Fixing climate change brings benefits beyond saving lives. Cleaner air, safer cities, and stable food supplies help everyone, even if they live far from the worst-hit areas.
Real-world Human Impact: Stories Behind The Numbers
Numbers are important, but behind every statistic is a person or community.
Example: Heatwave In Paris, 2003
- Over 15,000 people died in France, most were elderly and living alone.
- Many did not have air conditioning or help.
This disaster led to new policies, like heat warning systems and better care for seniors. But many other cities still lack such systems.
Example: Farmers In Sub-saharan Africa
- Droughts have killed crops and cattle.
- Families are forced to move to cities, creating new challenges.
Some farmers have tried new crops or techniques, like drip irrigation, to survive. But not everyone has the money or knowledge to adapt quickly.
Example: Small Island Communities
- People in Kiribati and Tuvalu are already planning to relocate as seas rise.
- Their cultures and homes may be lost forever.
For these communities, climate change is not just a physical threat, but also a cultural one. Moving means losing traditions, languages, and ways of life passed down for generations.
These stories remind us that every statistic is a life changed or lost. Solutions must be designed with real people in mind.
The Role Of Data In Understanding And Solving Climate Change
Accurate data helps us track change and plan for the future. Digital Madama believes that showing clear numbers can inspire action.
Why Statistics Matter
- They reveal trends that are not obvious day-to-day.
- Help governments make good policies.
- Show which solutions work (or do not).
For example, data showed that planting trees in urban areas can lower local temperatures by several degrees. This helps city planners choose where to spend money for the biggest benefit.
Common Mistakes With Climate Data
- Focusing only on one country or event.
- Ignoring long-term trends.
- Underestimating small, ongoing changes.
It’s easy to be distracted by dramatic events, like a big hurricane, and miss slow changes, like the steady loss of glaciers or rising CO₂ levels. Both matter.
Another mistake: using outdated or incomplete data. Climate science moves fast. Policymakers need the latest numbers to make smart decisions.
A final insight: Climate data is sometimes used to spread doubt or confusion. Always check the source and look for agreement among experts.
What Can Individuals Do?
Everyone can help slow climate change and protect lives. Here are some steps:
- Reduce energy use: Turn off lights, use efficient appliances, and unplug devices when not in use.
- Eat less meat: Animal farming produces a lot of greenhouse gases.
- Travel smart: Use public transport, walk, or cycle when possible.
- Support clean energy: Choose renewable power if you can.
- Talk about climate: Share facts with friends and family.
These steps may seem small, but they add up. For example, eating less beef can cut your personal emissions by up to 30%. Choosing a bike over a car for short trips saves money and reduces pollution.
Non-obvious Actions
- Use your voice: Vote for leaders and policies that prioritize climate action.
- Learn from others: Follow blogs like Digital Madama for up-to-date statistics and analysis.
Another idea: Join or support local groups working for cleaner air, better public transport, or tree planting. Community action can push governments to do more.
One more tip: Check the carbon footprint of products before buying. Many companies now label their products to show the emissions created during production.
What Should Governments And Businesses Do?
Big changes need big actions:
- Invest in renewables: Solar, wind, and hydro power reduce emissions.
- Protect forests: Trees absorb CO₂ from the air.
- Plan for disasters: Build stronger homes and early-warning systems.
- Help vulnerable groups: Support those most at risk, like the elderly and the poor.
- Set real targets: Promise to cut emissions and stick to the plan.
Governments can use taxes, laws, and incentives to speed up change. For example, some cities ban new gas cars after 2030. Others give money to homeowners who install solar panels.
Businesses play a key role. They can choose greener supply chains, use recycled materials, and switch to electric vehicles. Many customers now prefer companies that protect the environment.
Global Agreements
The Paris Agreement aims to limit warming to below 2°C. Countries must work together, or the numbers will get worse.
This agreement asks countries to set their own targets and report progress. It’s not perfect, but it’s a step in the right direction. Rich countries have promised to help poorer ones adapt and cut emissions.
One non-obvious fact: Local governments, like cities and states, can act even when national leaders do not. Many of the world’s biggest cities have their own climate plans, cutting emissions and preparing for disasters.
The Power Of Community And Information
Solving climate change takes everyone. Information is power—knowing the facts helps you make smart choices. Digital Madama is dedicated to sharing the latest climate data, environmental news, and in-depth analysis on how war and disasters affect our planet.
Communities that share knowledge and work together bounce back faster after disasters. They also find creative solutions, like building floating homes or planting drought-resistant crops.
A non-obvious insight: Sometimes, “old” knowledge—like traditional farming or water-saving practices—can help us adapt to a changing climate.
Frequently Asked Questions
What Is The Main Link Between Climate Change And Mortality Rates?
Climate change increases mortality rates by making heatwaves, floods, and diseases more common. High temperatures can cause heatstroke and dehydration. Floods and storms can cause injury and death, while warmer climates help diseases spread. Vulnerable groups, like the elderly and the poor, face the highest risk.
How Much Has The Global Temperature Risen So Far?
Since the late 1800s, the global average temperature has increased by about 1.2°C (2.2°F). This rise has already led to more extreme weather and higher mortality rates in many regions.
Which Countries Are Most Affected By Sea Level Rise?
Countries with large coastlines and low-lying areas are most at risk. This includes Bangladesh, the Maldives, Indonesia, and parts of the United States like Florida. Many small island nations face the risk of disappearing completely.
Can Reducing Carbon Emissions Really Make A Difference?
Yes, cutting carbon emissions can slow global warming, reduce extreme weather, and save lives. Every country, business, and individual can help by using less fossil fuel and supporting clean energy.
Where Can I Find Reliable Climate Statistics And Analysis?
For clear, up-to-date climate data and deep analysis, visit Digital Madama at Digital Madama. You’ll find articles, statistics, and expert insights on climate change, environmental disasters, and more.
Climate change is not just a future worry. The numbers show it is already reshaping our world and threatening lives. By understanding the data—and acting on it—we can protect our planet and ourselves.
For a deeper look at the latest climate science, data, and policy solutions, the [Intergovernmental Panel on Climate Change (IPCC)](https://www.ipcc.ch/) offers comprehensive and globally trusted reports.